on
A beginner's guide to Google Data Studio blending
As compared to tools like Tableau or Looker, Google Data Studio is pretty simple. However, for a lot of users, it will be their first confrontation with data manipulations like case formula or data blending. In this article, I’ll explain in detail how to blend data sources. It can be pretty intimidating, but don’t worry; it is not that complicated.
What is data blending?
Data blending is a feature of data studio allowing you to cross, merge, join (or whatever term you want to use) data sources. To understand how it works, imagine your data sources as tables of data. When blending data, you will cross these tables using a “join key.” A join key is a common element to your data sources. Based on this join key, a new blended data source will return all the rows from the second table matching a join from the first table. Let’s take a look at the following example:
In this example, we have two data sources presented as simple data tables. As the Name column is in the two tables, it will be our key join (our common identifier if you will). When blending these two tables, you get the table below where you can find all the information from the source one and the source two:
How to blend two sources
Setup
I’ll guide you step-by-step to blend two data sources. Let’s imagine we have two data sources. In the first source, we have three columns:
- Source / Medium
- Date
- Sessions
In the second source, we also have three columns:
- Source / Medium
- Date
- Offline Transactions
We want to combine these two sources to create a third table with four columns:
- Source / Medium
- Date
- Sessions
- Offline Transactions
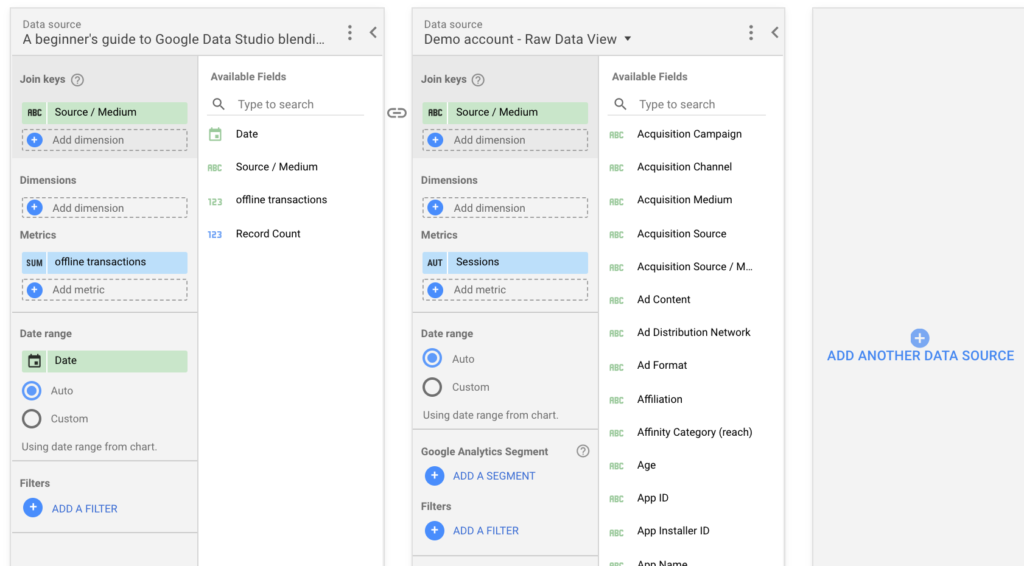
The Source / Medium column will be our join key as it is the common column of these two data sources.
Step-by-step guide
To open the blend data panel: Go to Ressource > Manage blended data > Add a data view.
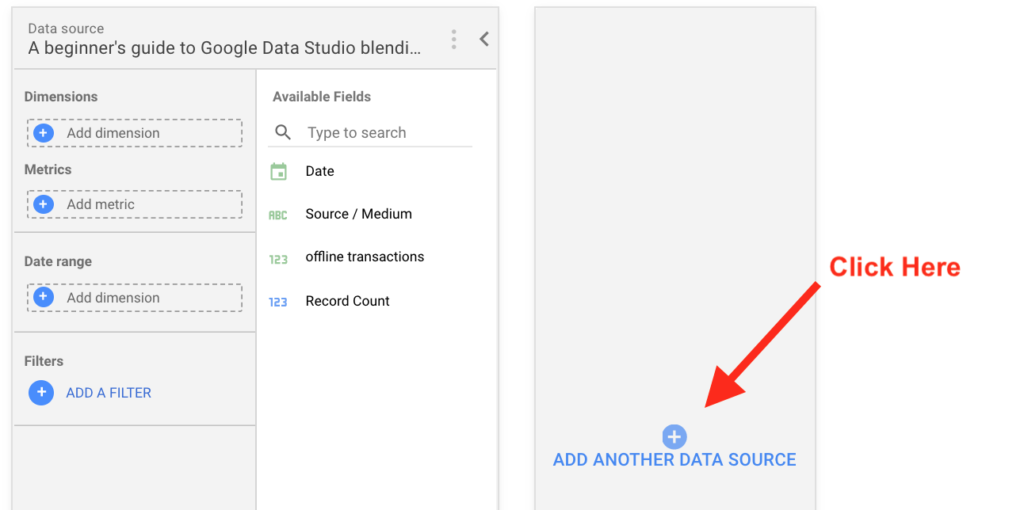
Click on one of the source listed under “Added Data Sources”.
- Click “Add another data source” and select your second data source.
- Now we need to fill all these empty fields. Add the “Source / Medium” field as a Join key for the two source. In the first source add offline transactions as metrics and Data as Dimension. In the second data source only add Sessions as a metrics.
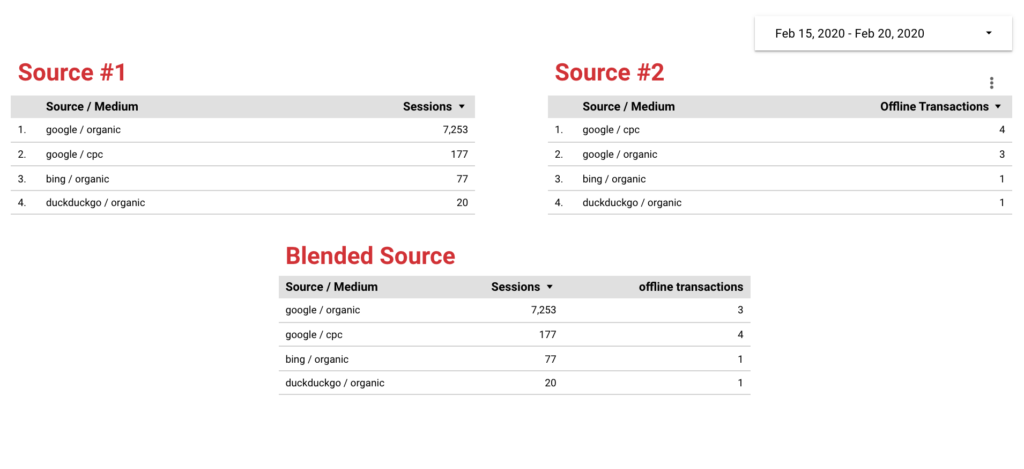
- Save modifications and create a table with your new blended data source. Check the numbers.
- You are done!
Final thoughts
- Data blending works easily when the data sources you want to blend are correctly formatted. You always need to have a common key.
- If you have specific issues or something is wrong (null values, duplicated rows) I would encourage you to read my article, “Mistakes to avoid when blending data with Google Data Studio”.
- Create fake data set with Google Sheets blend them to train and learn how to correctly blend data sources.
- If you really want to understand how data blending works and want to be able to debug more complex situation or create more complex data blending I would strongly encourage you to learn a bit more about SQL Joins.
- Be data skeptic. Always try to find a way to validate your data blended sources. You don’t want to find out from your boss or clients that some data doesn’t sum-up.


